SHRI SHIVAJI SCIENCE COLLEGE, AMRAVATI
DBT STAR COLLEGE PROJECT ACTIVITY
ACTIVITY REPORT

The carbon sequestration through community plantation with soil, climate and plant
Activity Dates: January to March 2026
Type of Activity: Minor Research Project
Organizing Department: Department of Environmental Science
Program Coordinators: Mr. V. D. Bute
Head of the Department: Dr. S. P. Ingole
External Collaborator (if any): No
Objectives:
- Tantalize the carbon sequestration ability and carbon footprint of the wani (belkheda) village in order to assess its environmental impact related to climate change.
- To assess the carbon sequestration potential of vegetation within the village in Amravati district.
- • To estimate the carbon stock generated from various community plantation activities.
- • To compare carbon sequestration and carbon emissions to evaluate the carbon balance of the village area.
- To determine whether the community plantation acts as a carbon sink or a carbon source.
No of Beneficieries: 02
Classes Involved: B.Sc. III year CEB and CEZ
Venue of the Activity: -
Activity Report:
Introduction
The environment refers to the surrounding conditions and influences that affect the growth, development, and survival of organisms. It includes both abiotic factors, which are non-living components such as soil, water, air, temperature, sunlight, and nutrients, and biotic factors, which are living components such as plants, animals, microbes, and humans. These factors interact continuously, shaping ecosystems and influencing ecological processes like carbon sequestration, nutrient cycling, and biodiversity. In the context of community plantations, both abiotic factors (soil type, moisture, and climate) and biotic factors (tree species, plant diversity, and microbial activity) play a critical role in determining the effectiveness of environmental restoration and sustainability
MATERIAL AND METHODOLOGY
Study Area
Location and Site Description
The present study was carried out in community plantation sites located in Wani (Belkheda) village, Chandur Bazar Taluka, Amravati District, Maharashtra, India. The study area lies between latitude 21.2339 °N and longitude 77.74°E. The region falls under tropical semi-arid climatic conditions characterized by hot summers and moderate monsoon rainfall. The present study was conducted in Wani Village, which is located near Amravati. The village is situated in the eastern part of Amravati district and is surrounded by agricultural land and scattered vegetation. The geographical location of the study area lies approximately between 20.93° N latitude and 77.75° E longitude.
The plantation area was established under community participation programs during the year 2014. The total plantation area covers approximately area 4.15km (4153 hectares). The dominant planted species include Azadirachta indica, Tectonic grand is, Dalbergia session, Cassia seamen and other native multipurpose tree species. These plantations were developed on previously degraded/open lands to enhance carbon storage, improve soil fertility and restore biodiversity.
The study was carried out in the Wani–Belkheda area, where community-based plantation activities have been implemented to improve environmental conditions and enhance carbon sequestration potential. The soil of the study area is predominantly black cotton soil (Vertisols) with moderate organic carbon content.
1. Climate Assessment Methodology (Seasonal Variation Study)
Study of Climatic Parameters
The climatic assessment was carried out to evaluate seasonal variations and their influence on carbon sequestration potential of community plantation. The climatic parameters showed clear seasonal variation. Maximum rainfall and relative humidity were observed during monsoon season, promoting higher biomass growth and carbon sequestration. Summer season exhibited high temperature and low moisture conditions, while winter showed moderate climatic conditions.
• SOIL PHYSICO –CHEMICAL PARAMETYERS:
Sr.no Parameters Method use Instrument Unit
1 Soil pH Digital pH
Meter
Method Soil: Water suspension (1:2.5 ratio) -
2 Electrical
Conductivity
(EC) Conductivity
Meter
Method Soil: Water extract
(1:2.5 ratio ds/m
3 Soil Organic
Carbon
(SOC) Walkley and Black (1934)
Wet
Oxidation
Method Titration method %
4 Bulk density Core
Method Oven drying at
105°C
g/cm3
5 Available nitrogen Alkaline KMnO₄ Method
Distillation method Kg/hc
6 Available phosphorus Olsen’s
Method Spectrophotometer Kg/hc
7 Available potassium Neutral
Ammonium
Acetate
Extraction Flame photometer Kg/hc
Soil carbon stock was calculated using: Soil samples were collected from 0–15 cm and 15–30 cm depths using a soil auger. Composite samples were prepared from each sampling plot. The samples were air-dried, sieved (2 mm mesh) and analysed for:
Soil carbon stock was calculated using the formula:
Soil Carbon Stock (Mg ha⁻¹) = Bulk Density × Soil Depth × % Organic Carbon
Parameter Unit Low Level Medium Level High Level
Parameter Unit Low Level Medium Level High Level
pH — < 6.5 6.5 – 7.5 > 7.5
Organic Carbon % < 0.5 0.5 – 0.75 > 0.75
Nitrogen (N) kg/ha < 280 280 – 560 > 560
Phosphorus (P) kg/ha < 10 10 – 25 > 25
Potassium (K) kg/ha < 120 120 – 280 > 280
Electrical Conductivity (EC) dS/m < 1.0 1.0 – 2.0 > 2.0
Soil Texture — Sandy Loamy Clayey
Source: Nut
METHOD FOR BIODEVERSITY ASSESSMENT
Biodiversity Assessment
Floral diversity was assessed using quadrat method. Species richness, Shannon– Wiener Index and Simpson’s Diversity Index were calculated. Faunal observations were recorded through direct and indirect methods such as field sightings and local interviews. Biodiversity Assessment
Vegetation Survey Method
Biodiversity assessment was carried out in the community plantation area of Wani (Belkheda) village established in 2014.
Sampling Method Quadrat method was used.
Height Measurement Using Sextant
The height (altitude) of an object was measured using a sextant, based on the principle of double reflection. The instrument was held vertically, and the telescope was aligned with the horizon. The index arm was adjusted until the image of the observed object coincided with the horizon line. The angle of elevation was then recorded from the graduated scale.
• For calculation of Carbon Sequestration the following steps are followed:
Determine the Total (Green) Weight of the Tree
Determine the Dry Weight of the Tree
Determine the Weight of Carbon in the Tree
Determine the Weight of Carbon Dioxide Sequestered in the Tree
Determine the Weight of Carbon Dioxide Sequestered in the Tree per Year
1. Determine the Total Green Weight of the Tree
Based on tree species in the Southeast United States, the algorithm to calculate the weight of tree is:
W = above ground weight of tree in pound
D = Diameter of the trunk in inches
H = Height of the tree in feet
For trees with D < 11:
W = 0.25 D² H
For trees with D ≥ 11:
W = 0.15 D² H
Depending upon the species, the coefficient could change, and the variable D² and H could be raised to exponents just above or below 1. However, these two equations could be seen as an average equation for all tree species.
The root system weighs about 20% as much as the above ground weight of the tree. Therefore, to determine the Total Green Weight of the Tree, multiply the above ground weight of the tree by 120%.
Total Green Weight = Above-ground Weight × 120%
2. Determine the Dry Weight of the Tree
3. Determine the Weight of Carbon in the Tree
4. Determine the Weight of Carbon Dioxide Sequestered in the Tree
5. Determination of Annual Carbon Dioxide Sequestration
RESULT
Climatic data
The climatic data collected during the study period indicated seasonal variations in temperature, rainfall, and relative humidity in the plantation area. The observations showed that the presence of tree cover helped in improving the local micro-climate conditions.
Overall, the plantation contributed to stabilizing the local climate by reducing temperature fluctuations, improving soil moisture retention, and increasing atmospheric humidity. These climatic conditions also support higher carbon sequestration and biodiversity in the study area.
Season Month Temperature
0C (Average) Relative
humidity
% Rainfall
(mm) Wind speed(km/he)
Summer Mar-Jun 30-45 30-35 30-60 8-10
Manson July-Oct 22-32 70-90 600-850 10-20
Winter Nov-Feb 12-22 40-62 15-25 5-10
Graph Of Climatic Data
SOIL READINGS SEASON -WISE
Seasonal variation in soil properties was observed during the study period. Soil pH ranged from 7.1 to 7.5 across different seasons, indicating neutral to slightly alkaline soil conditions. Soil moisture was lowest during the summer season (12%) and highest during the monsoon season (22%) due to increased rainfall. Organic carbon content was also higher in the monsoon season (0.90%) compared to summer (0.70%). Nitrogen availability varied from 210 to 235 kg/ha across seasons. These results indicate that seasonal climatic conditions influence soil properties and play an important role in supporting vegetation growth and carbon sequestration potential in the study area
Average reading parameter:
The study period was divided into three major seasons:
Season Soil pH Soil Moisture (%) Organic Carbon (%) Nitrogen kg/ha Phosphorus kg/ha Phosphate
Kg/ha
Summer 7.5 12 0.70 210 10 12
Monsoon 7.1 22 0.90 235 18 30
Winter 7.3 18 0.82 225 14 22
Soil nutrient dynamics under plantation ecosystems indicate a significant improvement in soil fertility compared to non-vegetated areas.
Available nitrogen (N) was recorded in the range of 250–500 kg/ha, which can be attributed to enhanced litter decomposition and biological nitrogen fixation processes. Soil phosphorus and phosphate showed clear seasonal variation under plantation systems. Available phosphorus ranged from 10–18 kg/ha, with the lowest in summer due to low moisture and reduced microbial activity, and the highest in monsoon due to enhanced mineralization and nutrient release. Similarly, phosphate (PO₄³⁻) ranged from 12–30 kg/ha, with maximum values in monsoon indicating improved nutrient solubilization under high moisture conditions.
Average soil parameter reading in pie chart
Biodiversity Assessment
The biodiversity assessment of the plantation site was carried out to evaluate the diversity of plant species and their ecological importance. The study area consisted of several tree species including Neem (Azadirachta indica), Bamboo (Bambusa bambox), Banyan (Ficus benghalensis), Ashok, Bor (Ziziphus mauritiana), Bel (Aegle marmelos), Apta (Bauhinia racemosa), and Pipal (Ficus religiosa).The plantation supported a variety of plant species which contributed to increasing the floral diversity of the area. These trees provide habitat, food, and shelter for different organisms such as birds, insects, and small animals, thereby enhancing the faunal diversity of the ecosystem.
Table: Species Composition
Sr no. Species name No of individuals Total Quadrants(Q) Quadrants Found(q) Density Frequency
1 Neem 35 10 7 0.035 70
2 Peepal 32 10 6 0.032 60
3 Banyan
30 10 5 0.030 50
4 Ashoka 34 10 7 0.034 75
5 Tamarind 31 10 6 0.031 60
6 Jamun 36 10 8 0.036 80
7 Aapta 33 10 6 0.033 15
8 Palash 37 10 7 0.037 70
9 bamboo 40 10 9 0.040 90
10 Bel 30 10 5 0.030 50
11 Kadu Badam 38 10 8 0.038 80
The carbon sequestration potential of the study area was estimated based on tree measurements and species composition recorded from 10 quadrats (10 × 10 m). The results indicate that all plant species contribute differently to carbon storage depending on their biomass and abundance.
The estimated carbon sequestration values varied among species due to differences in girth, height, and growth pattern. Species with larger girth and height exhibited greater carbon storage capacity. The total carbon dioxide (CO₂) sequestration of the study area was calculated to be approximate 8800.175 kg/year kg CO₂ per year.
Bar Digram of Species Composition
Estimation of Aboveground Biomass and Carbon
Annual Carbon Sequestration by Different Plant Species The carbon sequestration potential of different plant species present in the community plantation was estimated based on biomass calculation Based on the estimation of aboveground biomass, the plantation area has accumulated a considerable amount of carbon over the years. The biomass of trees acts as a major carbon sink by absorbing carbon dioxide (CO₂) from the atmosphere during photosynthesis and storing it in plant tissues such as stems, branches, leaves and roots.
Tree no. Height(m) Girth(cm) Frequency(no.of tree) Co2 per tree (kg/year) Total Co2 (kg/year)
1 4.81 11.811 37 39.805 1472.785
2 5.2 13.5 30 56.15 1684.5
3 4.3 10.2 40 26.52 1060.8
4 6.1 15.0 35 72.11 2523.85
5 5.8 14.1 32 64.32 2058.24
Carbon Sequestration by Trees in Plantation Area Total CO₂ Sequestration =8800.175 kg/year
Bar Graph : Tree Wise Total CO2 Sequestration
The carbon sequestration potential of plantation trees was estimated based on tree height, girth, and frequency. The results show that a total of 8800.175 kg of CO₂ per year is sequestered by the plantation trees in the study area, highlighting the importance of plantation activities in reducing atmospheric carbon dioxide and improving environmental sustainability. The carbon sequestration potential of plantation trees was estimated based on tree height, girth, and frequency. The results
The present study evaluates carbon sequestration through community plantation, along with an assessment of soil characteristics, climatic conditions, and biodiversity within the study area. The findings reveal that plantation activities play a significant role in capturing atmospheric carbon dioxide and storing it in both plant biomass and soil. The total estimated carbon sequestration was 8800.175 kg CO₂, demonstrating the positive environmental impact of community-driven plantation initiatives.
Outcomes:
- The study assessed the carbon sequestration ability and carbon footprint of Wani (Belkheda) Village.
- It estimated the carbon stock stored in village vegetation and community plantations.
- The comparison of carbon sequestration and emissions helped evaluate the carbon balance of the village.
- The findings determined whether the plantation area acts as a carbon sink or carbon source.
- Suitable measures were suggested to increase carbon sequestration and reduce carbon emissions.
Photos:
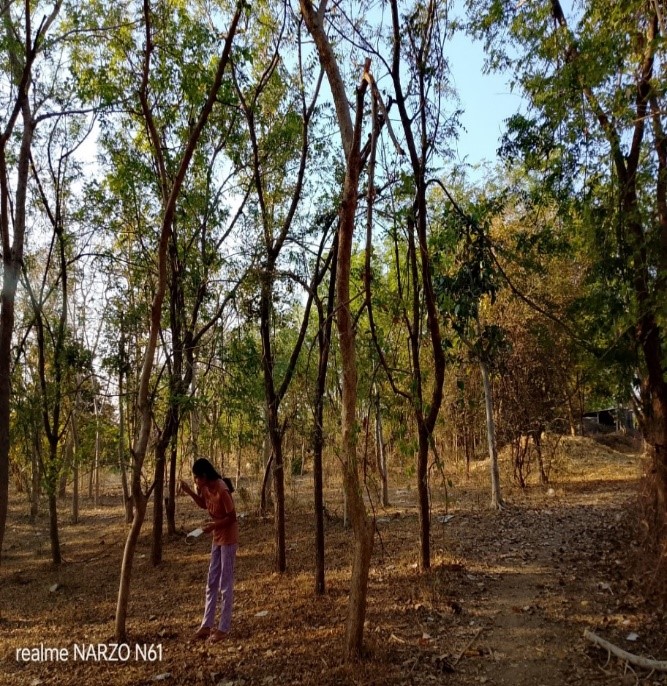 Plantaion at Wani Belkheda |  Sextant instrument use for measurement of plant height |
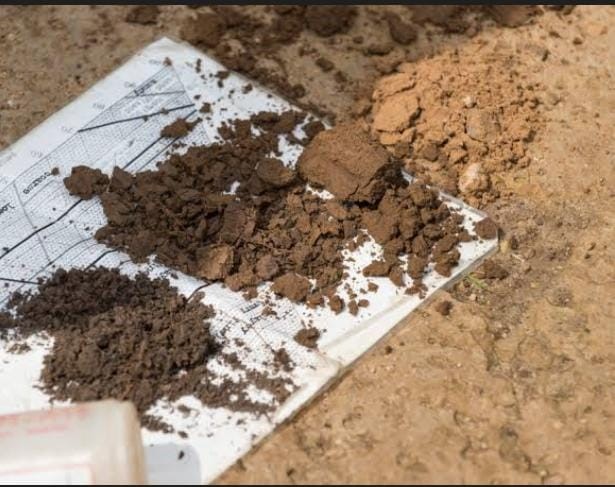 Soil sample collection | 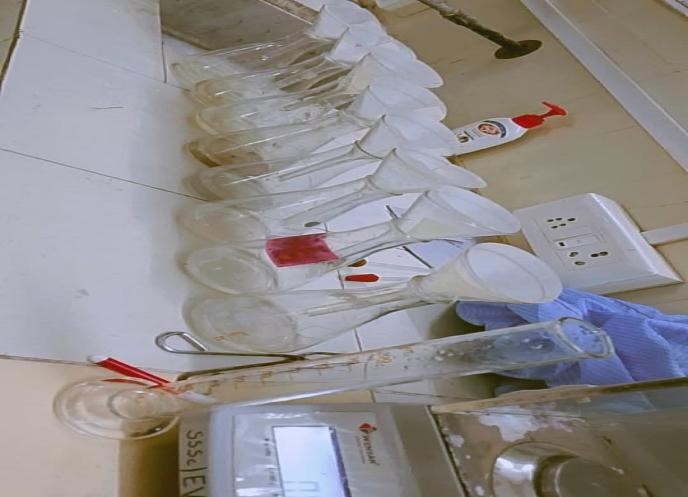 Lab work |
 Blank | 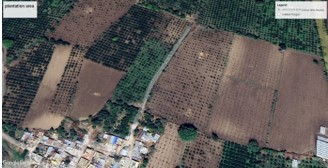 Wanibelkheda location |
Attendance Sheet: